Big Data Management Exercises
Principle in Data Science Exercises
Data Analytics Exercises
Data Mining Exercises
Network Security Exercises
Other Exercises:
Python String Exercises
Python List Exercises
Python Library Exercises
Python Sets Exercises
Python Array Exercises
Python Condition Statement Exercises
Python Lambda Exercises
Python Function Exercises
Python File Input Output Exercises
Python Tkinter Exercises


Principle of Data Science - Exercises 1
1. What message did you gain from the video ["Data Science: Where are We Going?" by Dr. DJ Patil]?Ans: With the presence of data science, it leads the society moving forward to data driven society. Data Science able to help another community to bring bigger value-added product after combining both of communities together.
2. Familarize yourself with DIKW pyramid by referring to the following link: https://towardsdatascience.com/rootstrap-dikw-model-32cef9ae6dfb Provide a holistic example on how data can move up to the next three levels.
Ans:
Data - Top Glove quarter sales drop
Information - The USD to MYR currency drops 30sen in the past 3 months, top glove quarter profit drop about MYR 5 million.
Knowledge - The decreasing in the USD to MYR currency will give negative impact to the top glove quarter profit. Most of the Top Glove products export to US market.
Wisdom - Based on the math model, we can predict changes of Top Glove profits with faster speed.
3. Digest a few definitions on data science and then come up with your own definition.
Ans: Data science is the combination of mathematics, statistics and computer science in order to convert the raw data into valuable information.
4. Data science process or methodology is a multi-step process. In general, data science works this way: formulate problem obtain data analysis produce data product. You have seen 4 DS process from week 1 lecture. Identify ONE different DS process and cite the source.
Ans: First: we have the Real World. Inside the Real World are lots of people busy at various activities. Specifically, we’ll start with raw data—logs, Olympics records, Enron employee emails, or recorded genetic material (note there are lots of aspects to these activities already lost even when we have that raw data).
We want to process this to make it clean for analysis. So, we build and use pipelines of data munging: joining, scraping, wrangling, or whatever you want to call it. To do this we use tools such as Python, shell scripts, R, or SQL, or all of the above.
Once we have this clean dataset, we should be doing some kind of EDA. In the course of doing EDA, we may realize that it isn’t actually clean because of duplicates, missing values, absurd outliers, and data that wasn’t actually logged or incorrectly logged. If that’s the case, we may have to go back to collect more data, or spend more time cleaning the dataset.
Next, we design our model to use some algorithm like k-nearest neighbor (k-NN), linear regression, Naive Bayes, or something else. The model we choose depends on the type of problem we’re trying to solve, of course, which could be a classification problem, a prediction problem, or a basic description problem.
We then can interpret, visualize, report, or communicate our results. This could take the form of reporting the results up to our boss or coworkers, or publishing a paper in a journal and going out and giving academic talks about it.
Alternatively, our goal may be to build or prototype a “data product”; e.g., a spam classifier, or a search ranking algorithm, or a recommendation system.
5. Distinguish between data analysis, data analytics and data mining. Illustrate how these three related to each other.
Ans:
Data Analysis refers to the process of separating a whole problem into its parts so that the parts can be critically examined at the granular level.
Data Analytics is a variety of methods, technologies and associated tools for creating new knowledge/insight to solve complex problems and make better and faster decisions
Data mining is processes to search right data sets and convert raw data structures into actionable insights by formulating or recognizing various patterns of data through the computational algorithms and logics.
Basically, data mining and data analytics are the subset of data analysis. Data analysis is responsible for developing models, explanations, testing and proposing hypothesis using analytical methods. While as, data mining is responsible for extracting and discovering meaningful patterns and structure in data which is part of data analytics.
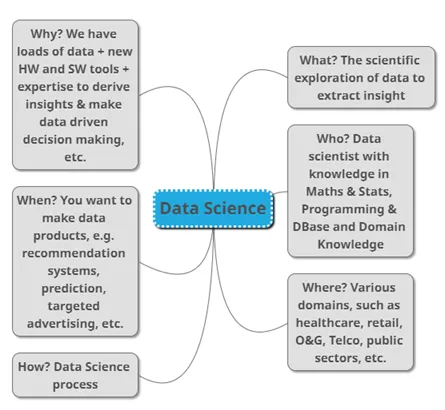
6. Based on your own understanding and using your own words, explain what data science is. You must use mind map or 5W 1H or drawing or any best and interesting way to assist your explanation, instead of just words.
Ans:
7. How datafication and analytics are related?
Ans: Datafication is putting data in a quantified format so it can be tabulated, analyzed, and enables prediction. Analytics is the science of understanding the cognitive processes an analyst uses to understand problems and explore data in meaningful ways. Data explosion is the fuel for analytics. Data on every aspect of our life is now tracked and stored in a quantified format, in databases and analytics allows us to turn this data into insights. For example, wearable devices, such as smart watches, Google glass and pedometers collect data.
8. Missing data in general is one of the trickier issues that is dealt with when cleaning data. The simplest solution is to delete rows with missing values. What is your advice to a data scientist who chose this option?
Ans: The first is that this approach only makes sense if the number of rows with missing data is relatively small compared to the dataset. If you are finding that you will be deleting more than around 10% of your dataset due to rows having missing values, you may need to reconsider.
The second issue is that in order to delete the rows containing missing data, you have to be confident that the rows you are deleting do not contain information that is not contained in other rows.
9. You are finding some json files data for your project. What would you add to your Google query to look for files with a json extension?
Ans: Add "+filetype:json"
10. You are a CIO who is hiring a few data scientists to help shape the future of your company. You intend to look at their portfolios when making hiring decisions. Anticipate at least FOUR things that you expect to see in an impressive data science portfolio.
Ans: When employers hire, they're looking for someone who can add value to their business. They will look at their Qualificiation, Knowledge, Skills, Attitude components. Most importantly their real world experience in DS. 4 components:
i. Candidate’s particulars, like in CV.
ii. Candidate’s DS knowledge & skills & attitude
iii. Candidate’s real world experience doing DS work
iv. Candidate’s contribution on DS, like participating in competition, bootcamp, talk, etc.
The number one way to build trust with a hiring manager is to prove you can do the work that they need you to do. With data science, this comes down to building a portfolio of projects. The more "real-world" the projects are, the more the hiring manager will trust that you'll be an asset to the business.
11. How to read the Data Science Venn Diagram shown below? Provide detail interpretation including each intersections.
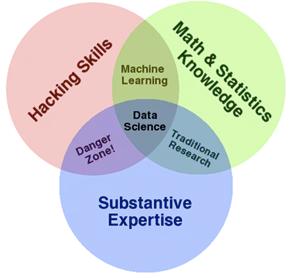
Ans:
The primary skills expected for data scientist: hacking skills, math and stats knowledge, and substantive expertise.
Hacking skills - Being able to manipulate text files at the command-line, understanding vectorized operations, thinking algorithmically.
Once data have been acquired and cleaned, the next step is to actually extract insight from it. In order to do this, DS need to apply appropriate math and statistics methods, which requires at least a baseline familiarity with these tools. For example, knowing what an ordinary least squares regression is and how to interpret it.
12. What makes a good data science culture? Express THREE principles that you think is important.
Ans:
i. Data accessibility
Data needs to be accessible:
• provide access to the real-raw data, don’t hide it behind abstraction layers and permission handling. Liberate it and let all employees see the data as is.
• table names, column names and data values should be explicit. Have some kind of a schema explorer / detection scripts to help you figure out where you need to look and which data set you need to query to get the results you are looking for.
ii. Cross domain availability
Some of the most interesting and profitable analysis i’ve ever made came from joining multiple data sources. For example - join sales data from a CRM with behavioral data and marketing data can really increase marketing ROI.
iii. Commitment and data integrity
Now that you have built it - it’s up to you to keep it alive - show graphs on company updates. Celebrate new data sets and achieved goals. Share your decision making process with your colleagues, encourage youe emploees to go on a data quest from time to time, and above all - keep the data real.
No one will use data they can not trust - so put your money where your mouth is and allocate resources - you can hire a data engineer or an ETL developer or use a SaaS ETL tool (like Alooma, this is where I work) to maintain a trust relationship between your people and their data.
BTW - if from time to time you make decisions that can not be backed by data - share this too. It’s important for a good data science company culture to keep things transparent and mostly to avoid analysis paralysis.
13. State THREE (3) types of data properties that you can investigate in exploratory data analysis (EDA).
Ans:
The center of the data
The spread among the members of the data
The skewness of the data
The probability distribution the data follows
The correlation among the elements in the dataset
Whether or not the parameters of the data are constant over time
The presence of outliers in the data
14. Why skipping EDA is a bad idea?
Ans:
Exploratory Data Analysis is valuable to data science projects since it allows to get closer to the certainty that the future results will be valid, correctly interpreted, and applicable to the desired business contexts. Such level of certainty can be achieved only after raw data is validated and checked for anomalies, ensuring that the data set was collected without errors. EDA also helps to find insights that were not evident or worth investigating to business stakeholders and data scientists but can be very informative about a particular business.
15. Which language is more suitable for text analytics? R or Python? Defend your answer.
Ans:
Since Python consists of a rich library called Pandas which allows the analysts to use high-level data analysis tools as well as data structures, while R lacks this feature. Hence Python will more suitable for text analytics.
16. Data scientist requires skills in statistics. Differentiate between descriptive statistics and inferential statistics.
Ans:
Descriptive statistics consist of methods for organizing and summarizing information.
Descriptive statistics includes the construction of graphs, charts, and tables, and the calculation of various descriptive measures such as averages, measures of variation, and percentiles.
Inferential statistics consist of methods for drawing and measuring the reliability of conclusions about population based on information obtained from a sample of the population.
Inferential statistics includes methods like point estimation, interval estimation and hypothesis testing which are all based on probability theory.
17. Linear Regression Analysis consists of more than just fitting a linear line through a cloud of data points.
Structure and explain the THREE (3) steps for linear regression.
Ans:
Firstly, a scatter plot should be used to analyze the data and check for directionality and correlation of data. Look for i) linear or non-linear pattern of the data and ii) deviations from the pattern (outliers). If the pattern is non-linear, consider a transformation. If there are outliers, you may consider removing them only IF there is a non-statistical reason to do so. This step enables the data scientist to formulate the model.
The second step of regression analysis is to fit the regression line. Fit the least-squares regression line to the data and check the assumptions of the model by looking at the Residual Plot (for constant standard deviation assumption) and normal probability plot (for normality assumption). Once a “good-fitting” model is determined, write the equation of the least-squares regression line. Include the standard errors of the estimates, the estimate of R-squared.
The last step for the linear regression analysis is the test of significance, which is evaluating the validity and usefulness of the model. Determine if the explanatory variable is a significant predictor of the response variable by performing a t-test or F-test. Include a confidence interval for the estimate of the regression coefficient (slope).
18. Discuss the FIVE (5) questions that machine learning can help answer, and for each question indicate the related algorithm.
Ans:
Is this A or B? (Classification algorithms)
How much / many? (Regression algorithms)
Is this weird? (Anomaly detection algorithms)
How is this organized? (Clustering algorithms)
What should I do now? (Reinforcement learning algorithms)
19. In enhancing reproducibility, what is your advice or principles in terms of facilitating reproducibility and enabling discoverability?
Ans:
To facilitate reproducibility, share the data, software, workflows, and details of the computational environment in open repositories.
To enable discoverability, persistent links should appear in the published article and include a permanent identifier for data, code, and digital artifacts upon which the results depend.
20. Exploratory analysis is largely concerned with summarizing and visualizing data before performing formal modelling.
a. Indicate FOUR purpose of exploratory data analysis.
Ans:
i. Check for missing data and other mistakes.
ii. Gain maximum insight into the data set and its underlying structure.
iii. Uncover a parsimonious model, one which explains the data with a minimum number of predictor variables.
iv. Check assumptions associated with any model fitting or hypothesis test.
v. Create a list of outliers or other anomalies.
vi. Find parameter estimates and their associated confidence intervals or margins of error.
vii. Identify the most influential variables.
b. The snapshot of the dataset “mtcars” is shown in Figure below.
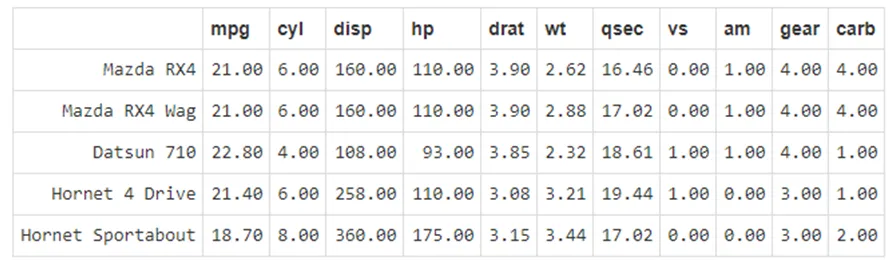
Show how you would perform the following exploration and manipulation on the given dataset.
i)Lists names of variables in the dataset.
Ans:
names(mtcars)
ii) Shows the number of rows/columns of the dataset.
Ans:
dim(mtcars)
iii) See a summary statistics of the Gross horsepower.
Ans:
summary( mtcars$hp)
iv) Display the structure of the dataset. Ans:
str(mtcars)
v) Visually check possible correlated variables.
Ans:
pairs(mtcars)
vi) Returns number of missing values in each variable of a dataset.
Ans:
colSums(is.na(mtcars))
vii) Replace all the am variables with words representation. Transmission (0 = automatic, 1 = manual)
Ans:
mtcars$am = as.character(mtcars$am)
mtcars$am[mtcars$am==0] <- 'automatic'
mtcars$am[mtcars$am==1] <- manual'
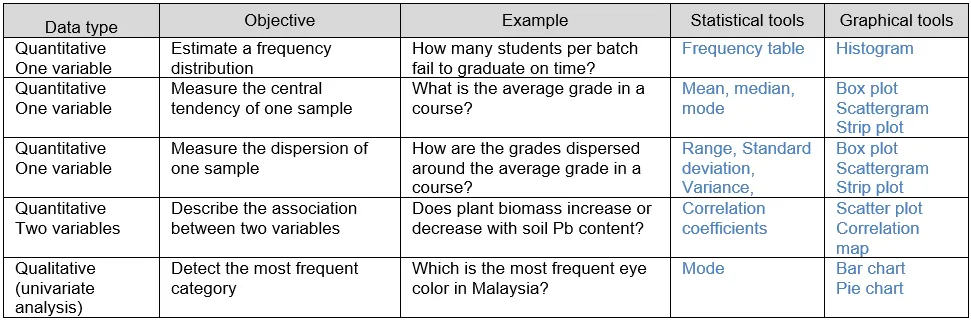
20c. Decide which descriptive statistics tool should you use according to the given situation.
Ans:
More Free Exercises:
Data Science ExercisesBig Data Management Exercises
Principle in Data Science Exercises
Data Analytics Exercises
Data Mining Exercises
Network Security Exercises
Other Exercises:
Python String Exercises
Python List Exercises
Python Library Exercises
Python Sets Exercises
Python Array Exercises
Python Condition Statement Exercises
Python Lambda Exercises
Python Function Exercises
Python File Input Output Exercises
Python Tkinter Exercises